3.jpg)

| Home |
|
About CASIX - Scientific background & drivers - Research programme structure - Management - NERC Steering Group |
|
News - News@CASIX - Science update |
|
Meetings & Events - Future meetings - Past meetings |
| Data |
|
Opportunities - Studentships - Jobs - Collaborations |
| Publications & presentations |
| People & Contacts |
| Links |
Michael Barkley and Paul Monks, EOS Group, University of Leicester
The major focus of the University of Leicester efforts within Project 3 has been the development of the Full Spectral Initiation (FSI) algorithm (described in detail in Barkley et al., 2006) which is designed to retrieve CO2 from space using the SCIAMACHY instrument, on-board ENVSIAT. The FSI algorithm is based on the WFM-DOAS technique (Buchwitz et al., 2000), whereby the total columns of a range of greenhouse gases can be retrieved from spectral measurements in the near-infrared, through the fitting of a model reference spectra plus its derivatives, to the measured sun-normalised radiance. In order to minimize the errors on the retrieved CO2 columns, the FSI algorithm is biased towards the use of a-priori data, generating a model reference spectrum for each individual SCIAMACHY observation using the known, or rather, estimated properties of the atmosphere and the surface at the time of the measurement. This approach is chosen in preference to performing global retrievals using only a finite number of reference spectra (e.g. Buchwitz et al., 2005). A schematic outlining the FSI algorithm is shown in Fig. 1.
|
|
|
Figure 1: A flow diagram of the Full Spectral Initiation (FSI) algorithm. |
|
|
|
Figure 2: SCIAMACHY CO2 retrievals for July 2003 averaged onto a 1° grid and smoothed with 3° box car average. |
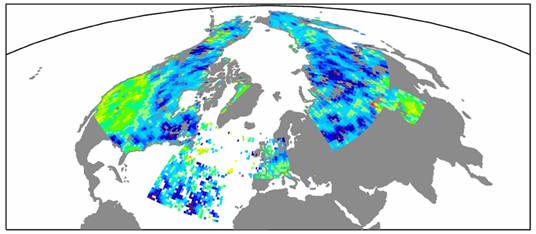
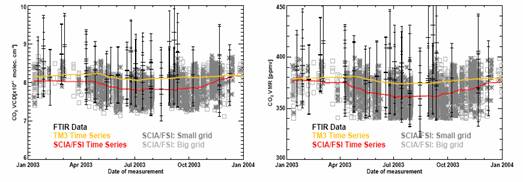
Successful SCIAMACHY CO2 retrievals (Fig. 2) have been performed using the FSI algorithm with comparisons made to both ground based FTIR and model data indicating that the first results are encouraging (Barkley et al., 2006b). Analysis with respect to the FTIR data indicate a bias of approximately -4% (Fig. 3), whilst comparison to the model data reveal an overestimation of the seasonal cycle by a factor of 2-3 and a smaller bias of about -2%.
|
|
|
Figure 3: (a) Left Panel: The ground based FTIR CO2 vertical column densities (VCDs), in units of molecule/cm2, (±9.8% error, black crosses) and the FSI retrieved VCDs grouped as a large grid (within ±10.0° longitude and ±2.5° latitude, light grey squares) and a small grid (within ±5.0° longitude and ±2.5° latitude, dark grey stars) relative to the FTIR instrument, located at Egbert, Canada. Red line: A 31 point box-car average of the (daily averaged) FSI CO2 VCDs. Orange line: A 31 point box-car average of the (daily averaged) TM3 model data interpolated onto the Egbert location. (b) Right Panel: As left but for the column volume mixing ratios VMRS (i.e VCDs normalized by the input a-priori ECMWF surface pressure). |
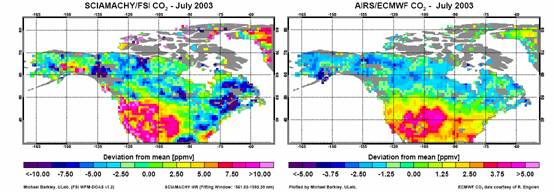
Furthermore, comparisons to CO2 retrieved by the AIRS instrument (Engelen et al., 2005) also show good qualitative agreement of large scale features over North America during 2003 (Barkley et al., 2006c). This comparison demonstrates for the first time some general consistency in the retrieved CO2 distributions measured by two different sensors (Fig. 4). In addition, both AIRS and SCIAMACHY detect seasonal signals that are representative of the upper and lower troposphere to which they are both respectively sensitively to.
|
|
|
Figure 4: Left Panel: SCIAMACHY monthly averaged VMR deviations relative to its North American mean. Right Panel:AIRS monthly averaged VMR deviations relative to its North American mean (AIRS data courtesy of Richard Engelen, ECMWF). |
The potential ability of SCIAMACHY to identify sub-continental scale sources/sinks at the surface is illustrated in Fig. 5, which shows the land vegetation type verses FSI retrieved CO2 over North America during July 2003. There is a clear correlation between the low CO2 concentrations found over the Canadian Shield and down the eastern side of the US in contrast to the higher CO2 found over the grass plains and croplands of the mid-west US. This suggests greater CO2 uptake by the forests as compared to the crop lands. Future work by the University of Leicester will focus on improving the accuracy and precision of the FSI retrievals and the identification of surface sources and sinks.
|
|
|
Figure 5: Left Panel: The land vegetation type taken from the MODIS land ecosystem classification product. Right Panel: SCIAMACHY CO2 during July. |
References:
Barkley, M. P., Frieß, U. and Monks, P. S. (2006a), Measuring atmospheric CO2 from space using Full Spectral Initiation (FSI) WFM-DOAS, Atmos. Chem. Phys. Discuss., 6, 2765–2807.
Barkley, M. P., Monks, P. S., Frieß, U., Mittermeier, R. L., Fast, H., Korner, S., and M. Heimann (2006b), Comparisons between SCIAMACHY atmospheric CO2 retrieved using (FSI) WFM-DOAS to ground based FTIR data and the TM3 chemistry transport model, Atmos. Chem. Phys. Discuss., 6, 5387–5425.
Barkley, M. P., Monks, P. S. And Engelen, R. J. (2006c): Comparisons of SCIAMACHY and AIRS CO2 measurements over North America during 2003”, Barkley et al., in review Geophys. Res. Letts,.
Buchwitz, M., Rozanov, V.V. and Burrows, J. P. (2000), A near-infrared optimised DOAS methods for the fast global retrieval of atmospheric CH4, CO, CO2, H2O and N2O total column amounts from SCIAMACHY Envisat-1 nadir radiances, J. Geophys. Res. 105, 15231-15245.
Buchwitz, M., de Beek, R., Noel, S., Burrows, J. P., Bovensmann, H., Bremer, H., Bergamaschi, P., Korner, S., and Heimann, M.: Carbon monoxide, methane and carbon dioxide columns retrieved from SCIAMACHY by WFM-DOAS: year 2003 initial data set, Atmos. Chem. Phys., 5, 3313–3329, 2005.
Engelen, R. J., and A. P. McNally (2005), Estimating atmospheric CO2 from advanced infrared satellite radiances within an operational four-dimensional variational (4D-Var) data assimilation system: Results and validation, J. Geophys. Res., 110, D18305, doi:10.1029/2005JD005982.